Interactive Visualization of Machine Learning Model Results Predicting Infection Risk
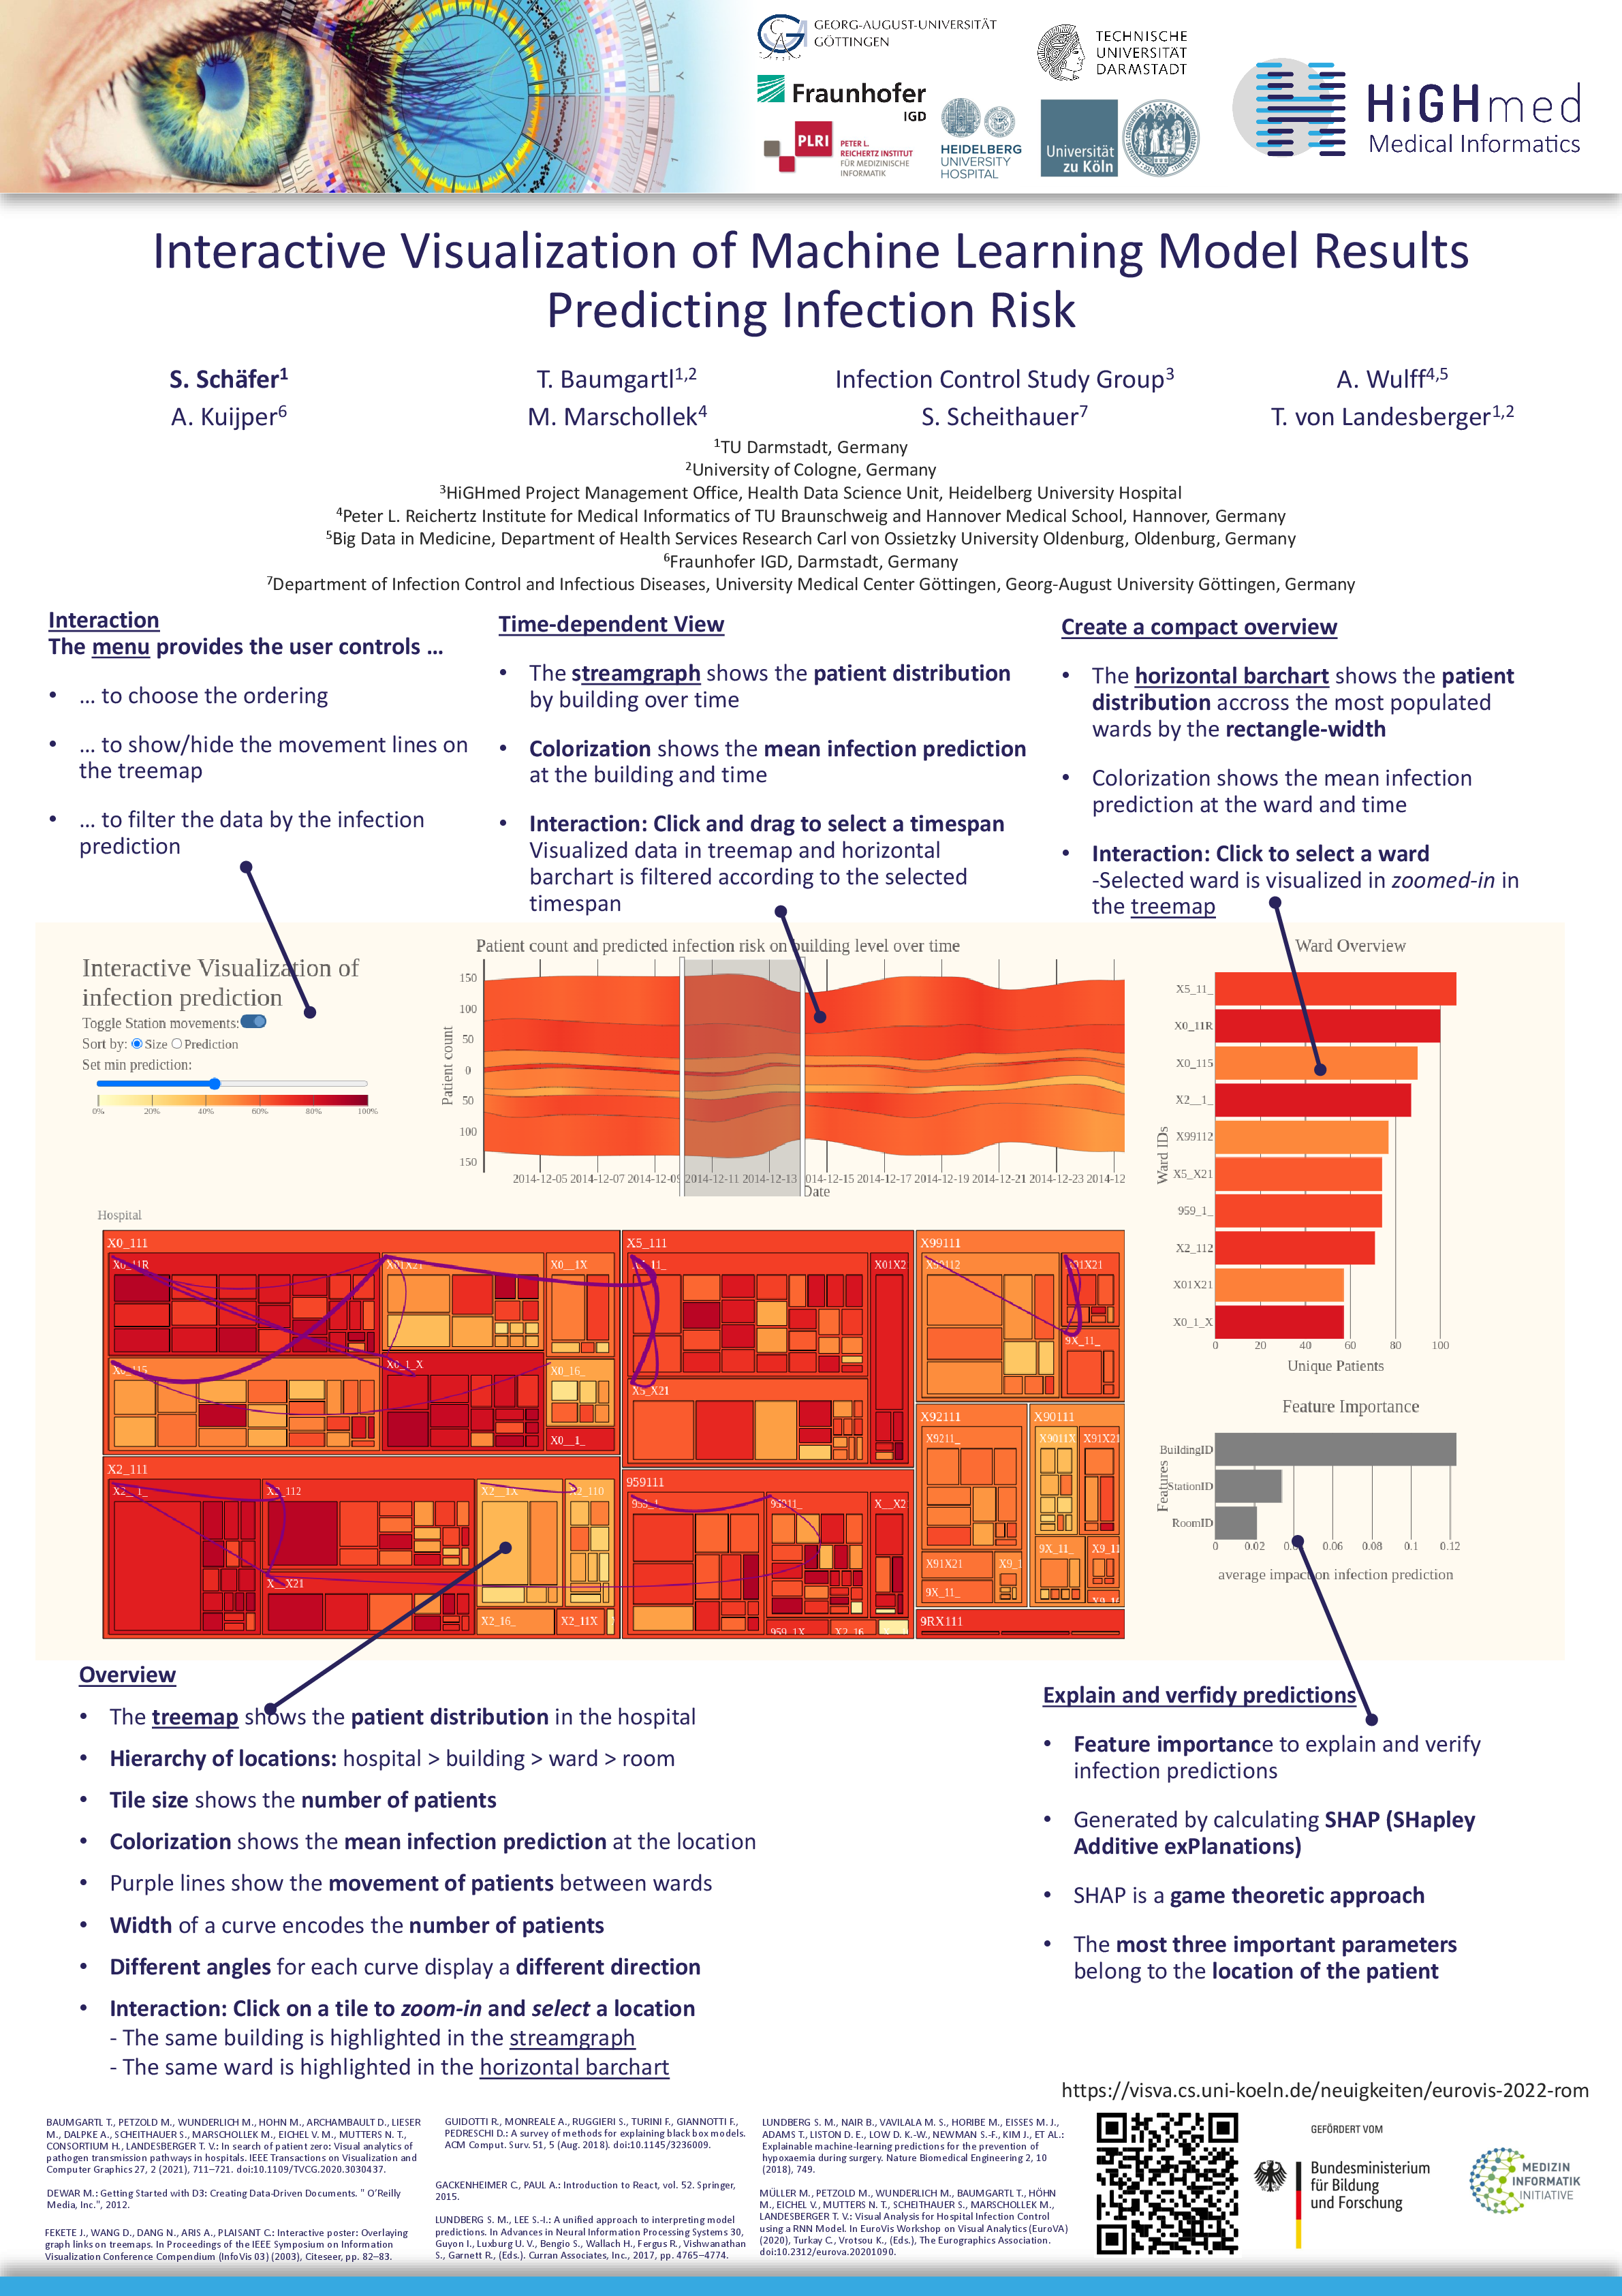
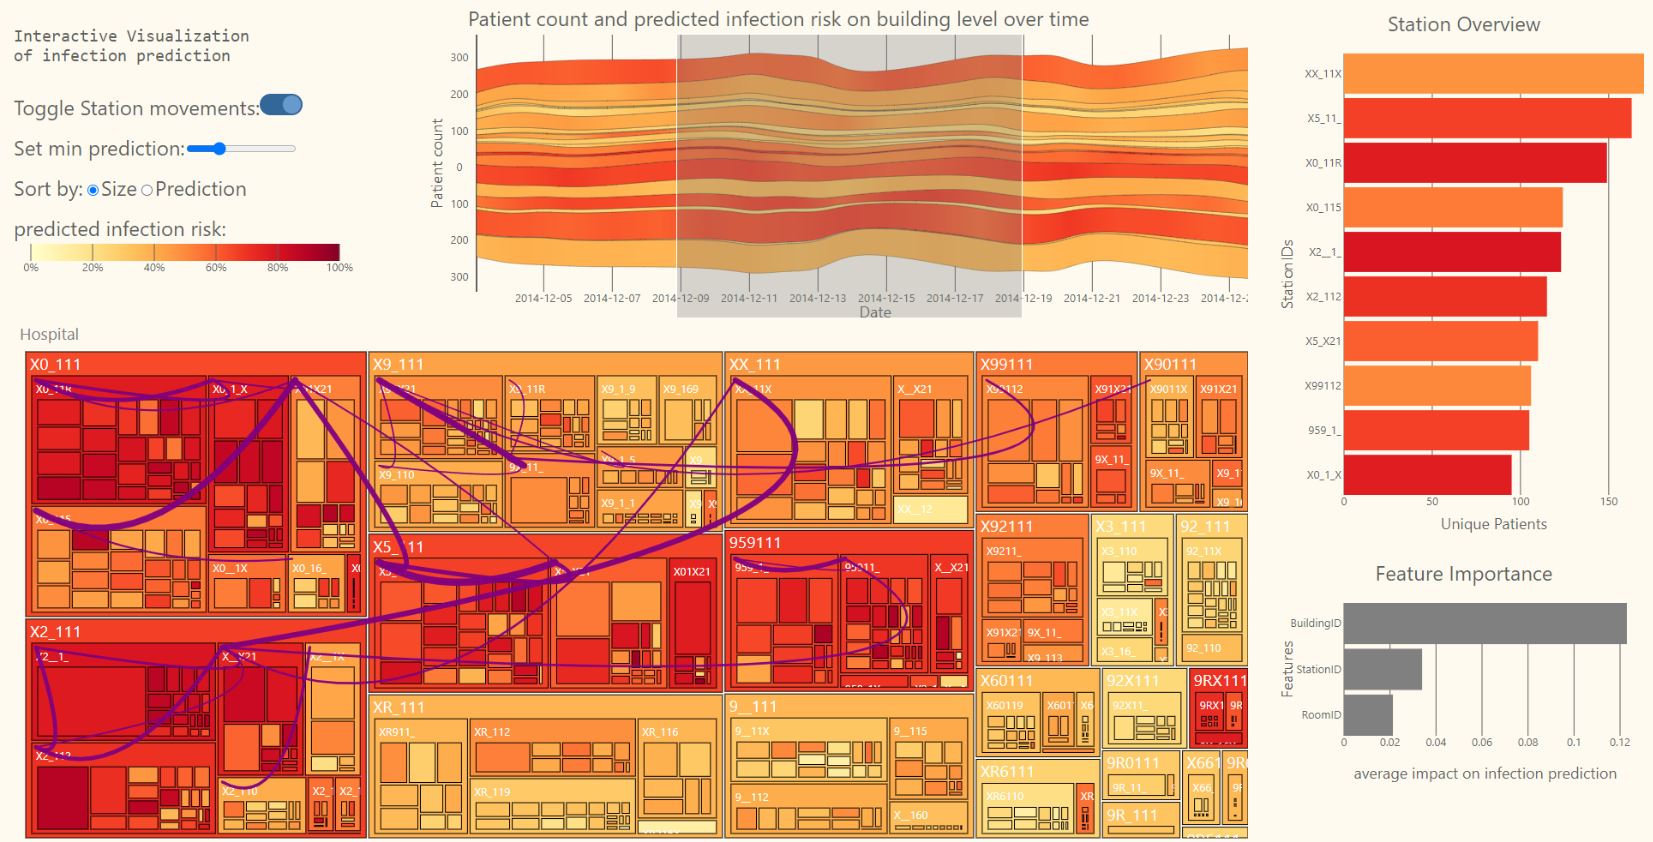
The dashboard presented in this poster is designed to provide insights into the results of a machine learning algorithm and to support the trust towards it. The algorithm is made to make predictions about potential infection probabilities, the probailities are based on infections and movement data. In the center of the dashboard is a treemap showing the individual buildings, wards and rooms with the corresponding infection probabilities and movements between them in the form of Bézier curves.
___________________________________________________________________________________________________________________________________
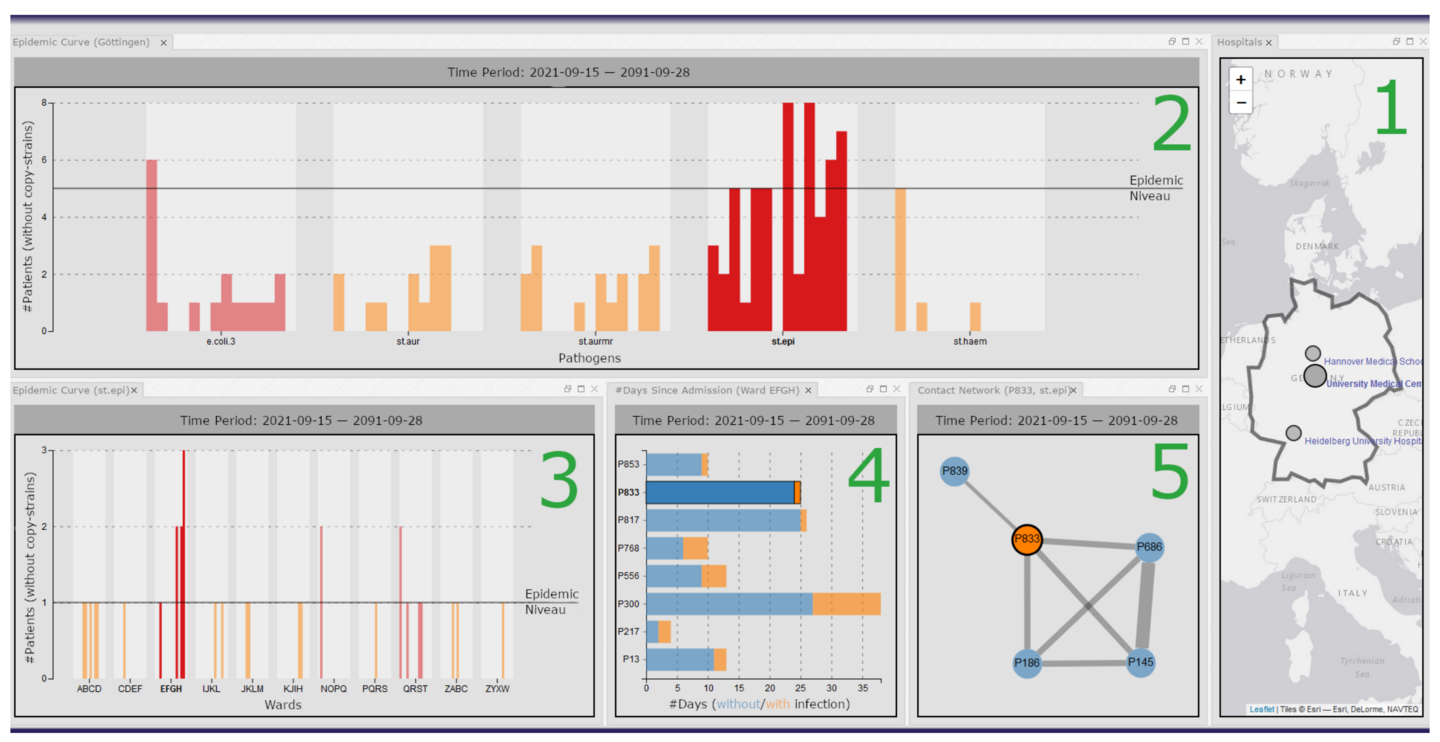
In Search of Patient Zero: Visual Analytics of Pathogen Transmission Pathways in Hospitals
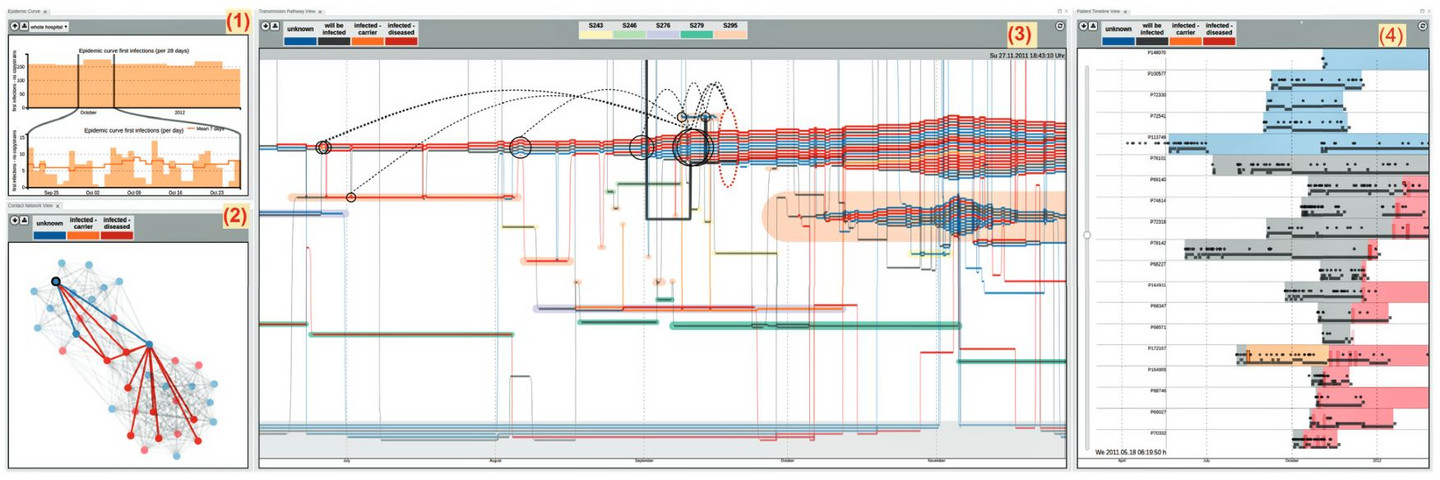
IEEE Transactions on Visualization and Computer Graphics, 27(2):711-721, 2020
Experts need complex analysistools to secure the possibility of tracking a Pathogen Transmission Pathway. Within this paper such a tool was developed and evaluated. A clever connection between contact networks and epidemic curve views manipulated the storyline diagramm in the center. With a combination of all of them it is possible to spot outbreaks and identify the index patient.
___________________________________________________________________________________________________________________________________
Visual Analytics for Hospital Infection Control using a RNN Model
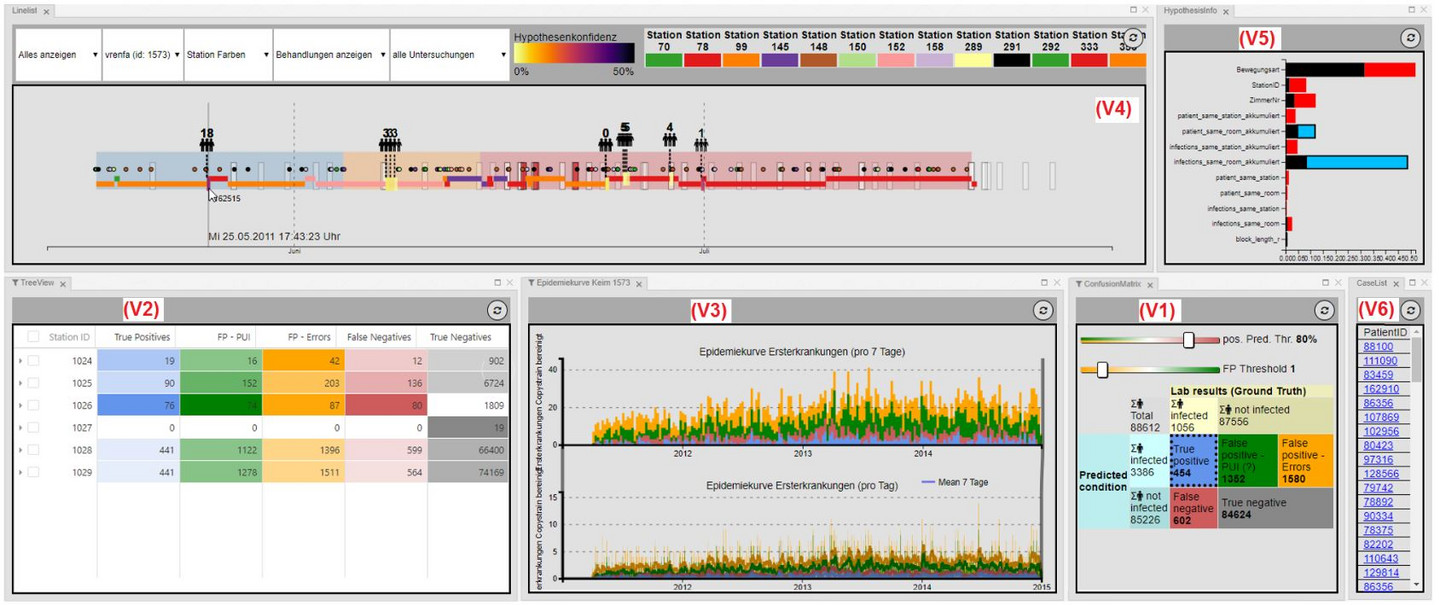
EuroVA@ Eurographics/EuroVis pp. 73-77, 2020
The ouputs of a recurrent neural network, which was used to detect infection chains and infection probabilities of individual patients, have to be visualized. In addition to newly presented visualizations, already established graphs and visualizations were further improved using sliders and selectors to provide better analysis. The result of this paper is not a presentation of the RNN, but instead to widen the view of the experts in a use case and to present a more reliable way of interpreting the results.
___________________________________________________________________________________________________________________________________
Visual-Interactive Exploration of Pathogen Outbreaks in Hospitals
EuroVis Posters: 9-11, 2019
The focus of this poster is to develop an understanding of the work steps of a hygiene expert. Based on the dashboard shown, the sequence in which the individual visualizations are viewed and the specific tasks that can be performed with them are explained. In addition, the links between the visualizations are gone through using an example.
___________________________________________________________________________________________________________________________________
Visual Analysis of Probabilistic Infection Contagion in Hospitals
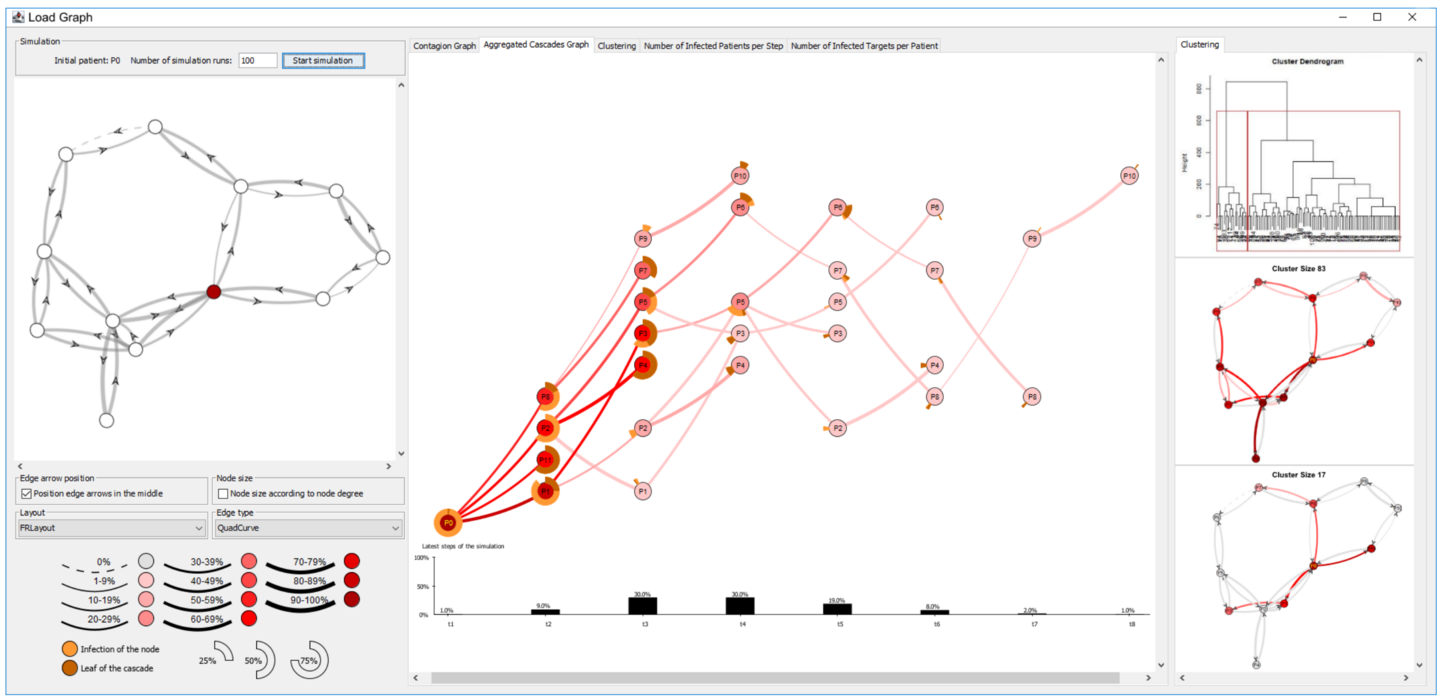
Vision, Modeling and Visualization pp. 143-150, 2019
How a disease spreads within a large population is a commonly observed phenomenon. The visualization forms from this paper are used to represent how a disease spreads in a somewhat smaller setting, such as hospital stadiums. Monte Carlo simulations with underlying S-I models were performed for this purpose. The analysis of the results of this simulation is enabled by a contact network, which is enhanced by additional linked visualizations.
___________________________________________________________________________________________________________________________________
Early Detection of Infection Chains & Outbreaks: Use Case Infection Control
ICT for Health Science Research, Stud Health Technol Inform, 258:245-6, 2019
This document includes the overall goals of the Use Case: Infection control of HiGHmed, including the desired benefits that SmICS should bring to both hospitals and researchers. Examples at this point include:
- Facilitate the tracking of pathogen propagation
- Design of interactive visualization capabilities to track pathogen and patient movement
- Improve patient care
- Reduce costs of the health care system
___________________________________________________________________________________________________________________________________